


Randy’s Varroa Model
I feel that our industry and research community has long needed a useful, accurate, and user-friendly varroa population model–so I spent a year of early mornings and weekends creating this one. You can use this model to predict what sort of mite management strategy will work in your area.
Be sure to view the tutorials listed below before you attempt us use the model!
The model runs best in Excel. If you don’t have Excel on your computer, Trish Harness has a simplified online model that you can use on your cell phone at https://www.chickabuzz.com/model.html
Note the number of the version, since I continually update the model–always use the most current version. The current version is:
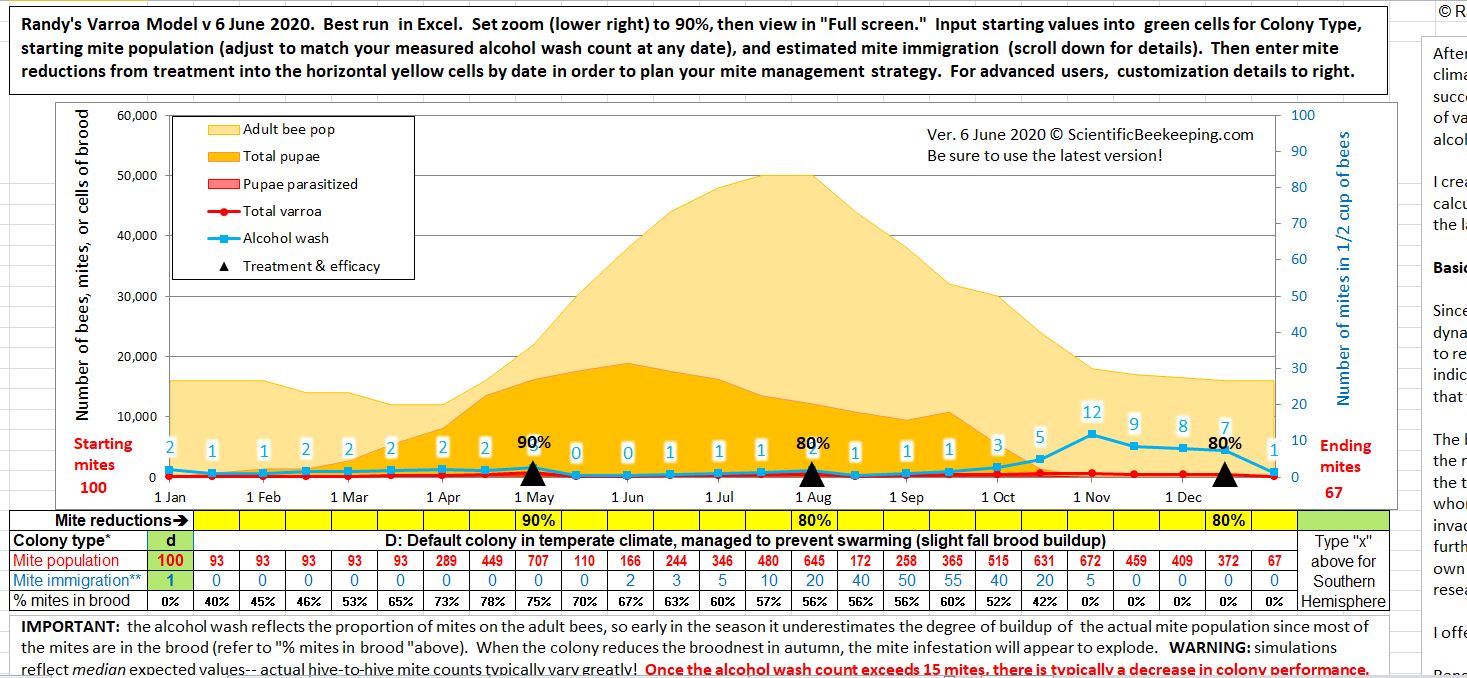
For Joe Beekeeper, the model is easy to use (see the snip below)–you simply type inputs into the three green cells to the left to see whether your colony is likely to crash. In order to avoid such a crash, you can then apply one or more “treatments” (percent mite reductions) on any date in the yellow cells below the graph–each time you click on another cell or hit “enter,” the model instantly runs a new simulation. By this method, you can test various mite management strategies at your computer.
Update June 2020: Thanks to a suggestion by Trish Harness, I revised the model to put the input cells for mite treatment directly under the dates in the graph. This makes the effects of treatments much easier to visualize.
To use the model, you will need to have Microsoft Excel installed on your computer (it doesn’t work well in Google Sheets or Open Office, but appears to work with Linux Libre Office and with Numbers in Mac, but the output may not be the same). I hope someday to have an online version (I’d appreciate help). See *** below if you are using an older version of Excel.
The model is quite simple to use, but I’ve found that a visual demonstration really helps those trying it for the first time. To that end, I created a few tutorials on YouTube. I strongly suggest that you view them step by step, by clicking on the blue links below:
Tutorial #1 (10:02): Basic introduction–how to download and open the Excel workbook (including the best viewing settings), and how to use an included simplified model to explain basic varroa population dynamics and necessary mite reductions (I’ve also included printable written instructions at the bottom of this webpage).
Tutorial #2 (8:56): How to work with the model to understand varroa buildup and the effects of treatments. I show the example of how I use the model for mite management in my own operation.
Tutorial #3 (8:29): For moderately-advanced users who wish to customize the model by inputting the regionally-specific “Colony” parameters for their ecoregion and management style.
Tutorial #4 (5:35): Intended for bee researchers, bee breeders, and advanced users who want to gain a deeper understanding of varroa population dynamics, mite management, and the effects of various traits for mite resistance. It also shows how to better understand how the model produces its simulations.
Attention Excel geeks, modelers, and varroa researchers
*** Beekeeper Matthew Waddington points out that pre-2008 Excel uses a different Poisson function. The fix is to change the function name in all the cells in column BO to
=1-(POISSON(0,BN4,FALSE))
That said, I am not a mathemetician, a modeler, nor good with Excel. This model is a work in progress, and I’ve revised it nearly every day over the past several months. Please help me to further fine tune and improve it for use by all.
I’ve put explanatory comments in any cell that says “comment’–just click on it to view. I’ll be happy to unlock the formulas for you in return for an agreement to respect my intellectual property.
Printable Basic Instructions
Once you open the workbook in Excel, click “enable editing.”
In order to prevent inadvertent changes to the wrong cells, I’ve locked all the cells other than those ready for user inputs (the yellow cells).
Then go to the bottom right corner of the window and set to 90% view, then to the “View” tab at the top, and hit “Full Screen” (hit “Escape” on your keyboard if at any time you wish to exit Full Screen view).
I suggest that you first open the “Necessary mite reduction” tab at the bottom to get an idea of the basic concept. Type in various numbers of months with brood, and different treatment percentages in order to understand how much varroa control you will need for your region.
After you’ve got the concept, then switch over to the “Current Version” tab to use the model itself.
All the instructions that most beekeepers will need are under the “Instructions” on rows 26-34. There aren’t very many instructions, so please read these first!
I suggest starting with the Default “Colony” (type “d” into cell B29, “100” mites in B31, and “1” for immigration in B33. If you keep bees in the Southern Hemisphere, type an “x” into P27.
After you’ve played with the Default colony by entering mite treatments, then you’ll want to go to the “Colony” tab, and either choose a colony type for your area, or create your own colony profile (please send me any accurate regional colony profiles, so that I can post them). View Tutorial #3 before attempting to create your colony!
Those with greater interest can go down to the green cells in the “Advanced” section of the Current Version tab, and type in the word “custom” to investigate the effects of changing key parameters involved in mite population buildup.
Have fun!
Randy